Process Modelling
BPMN
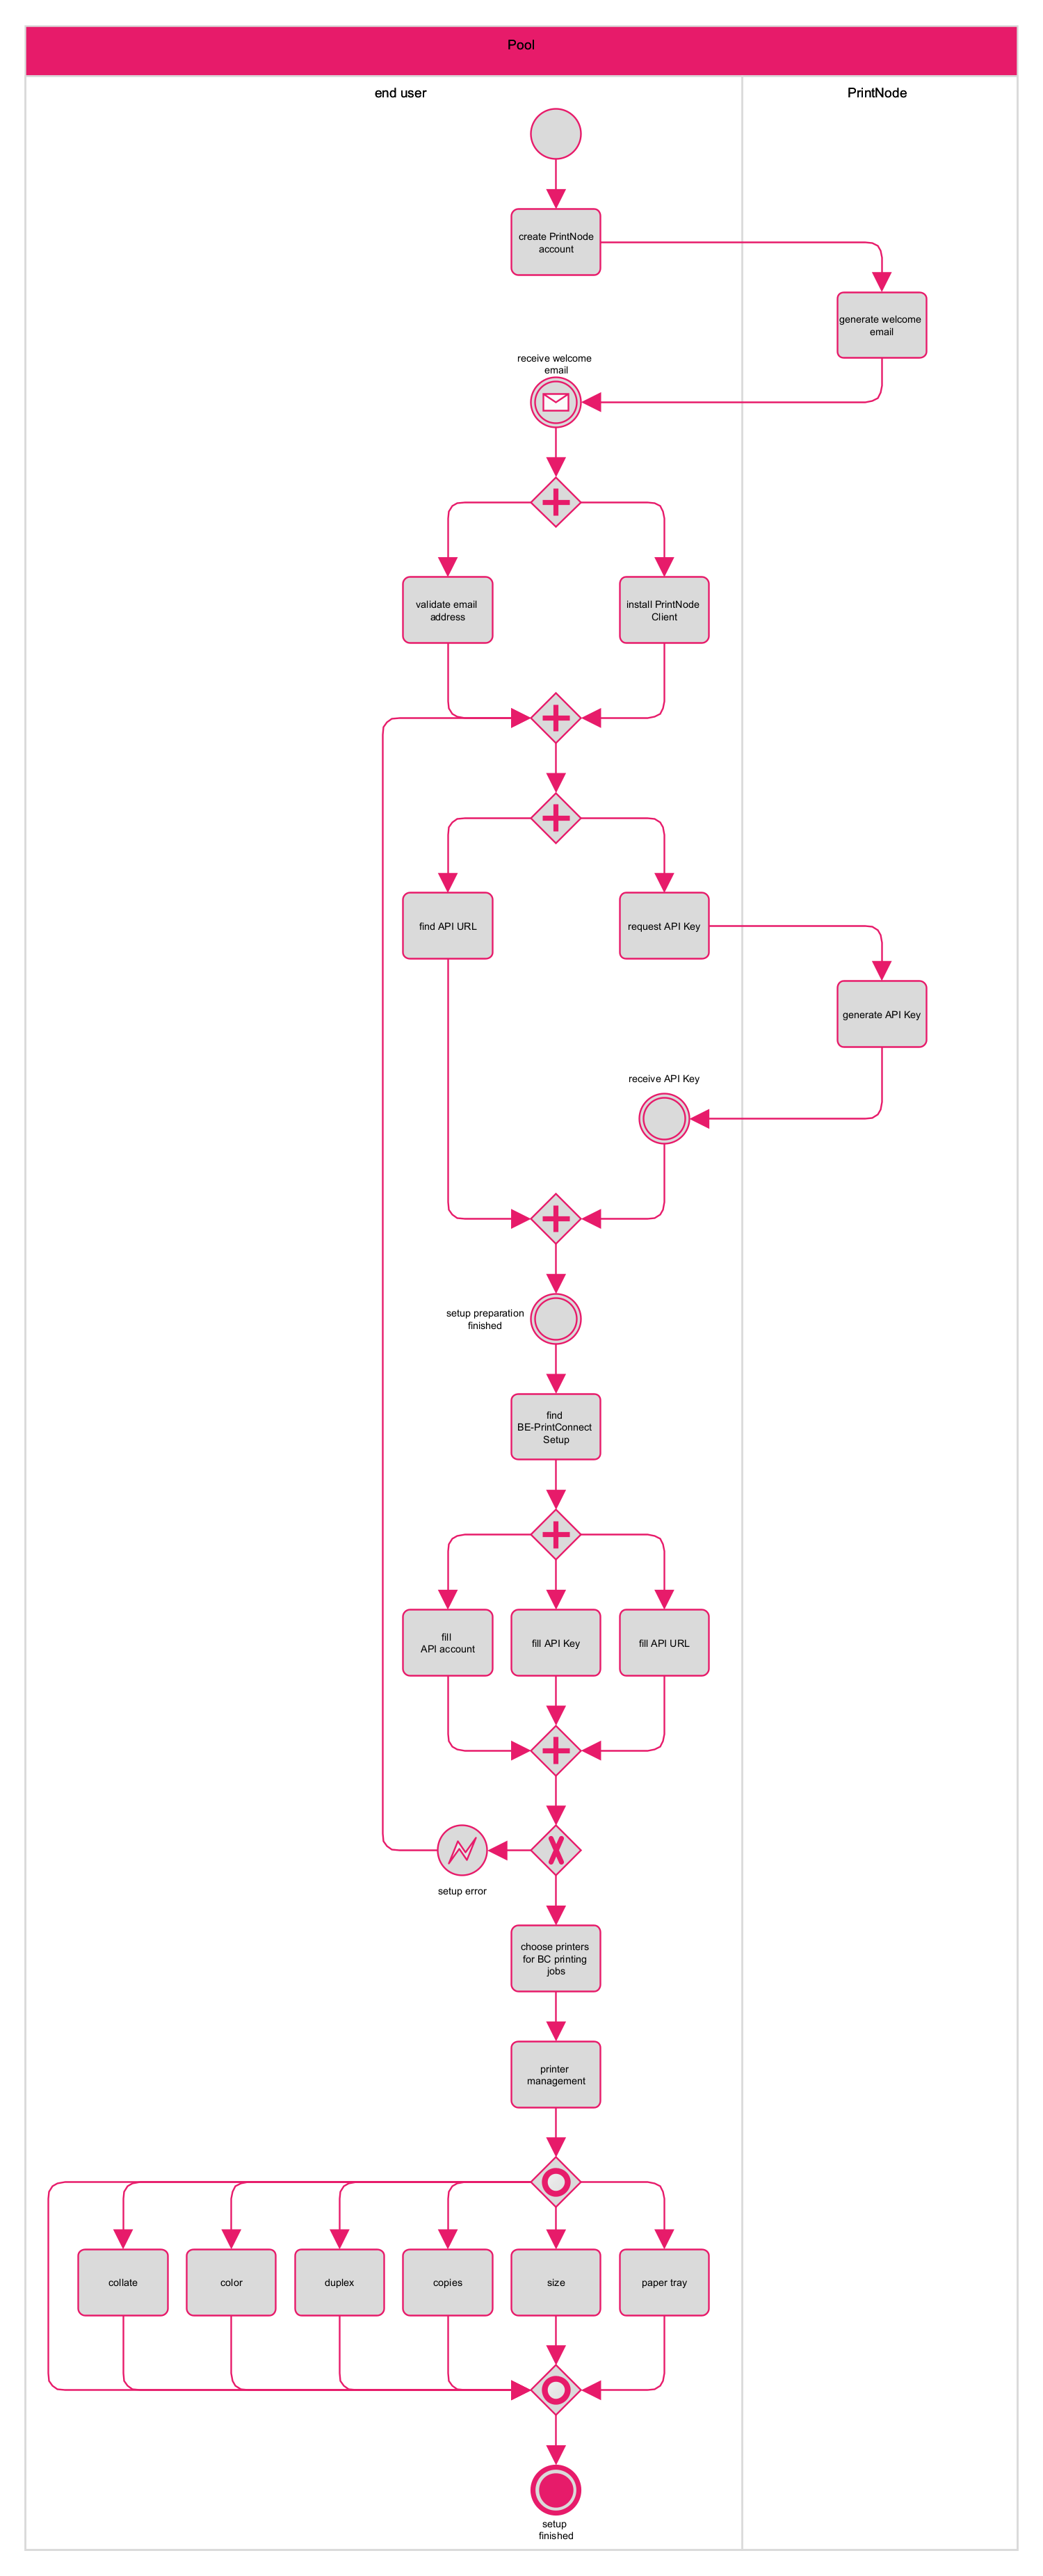
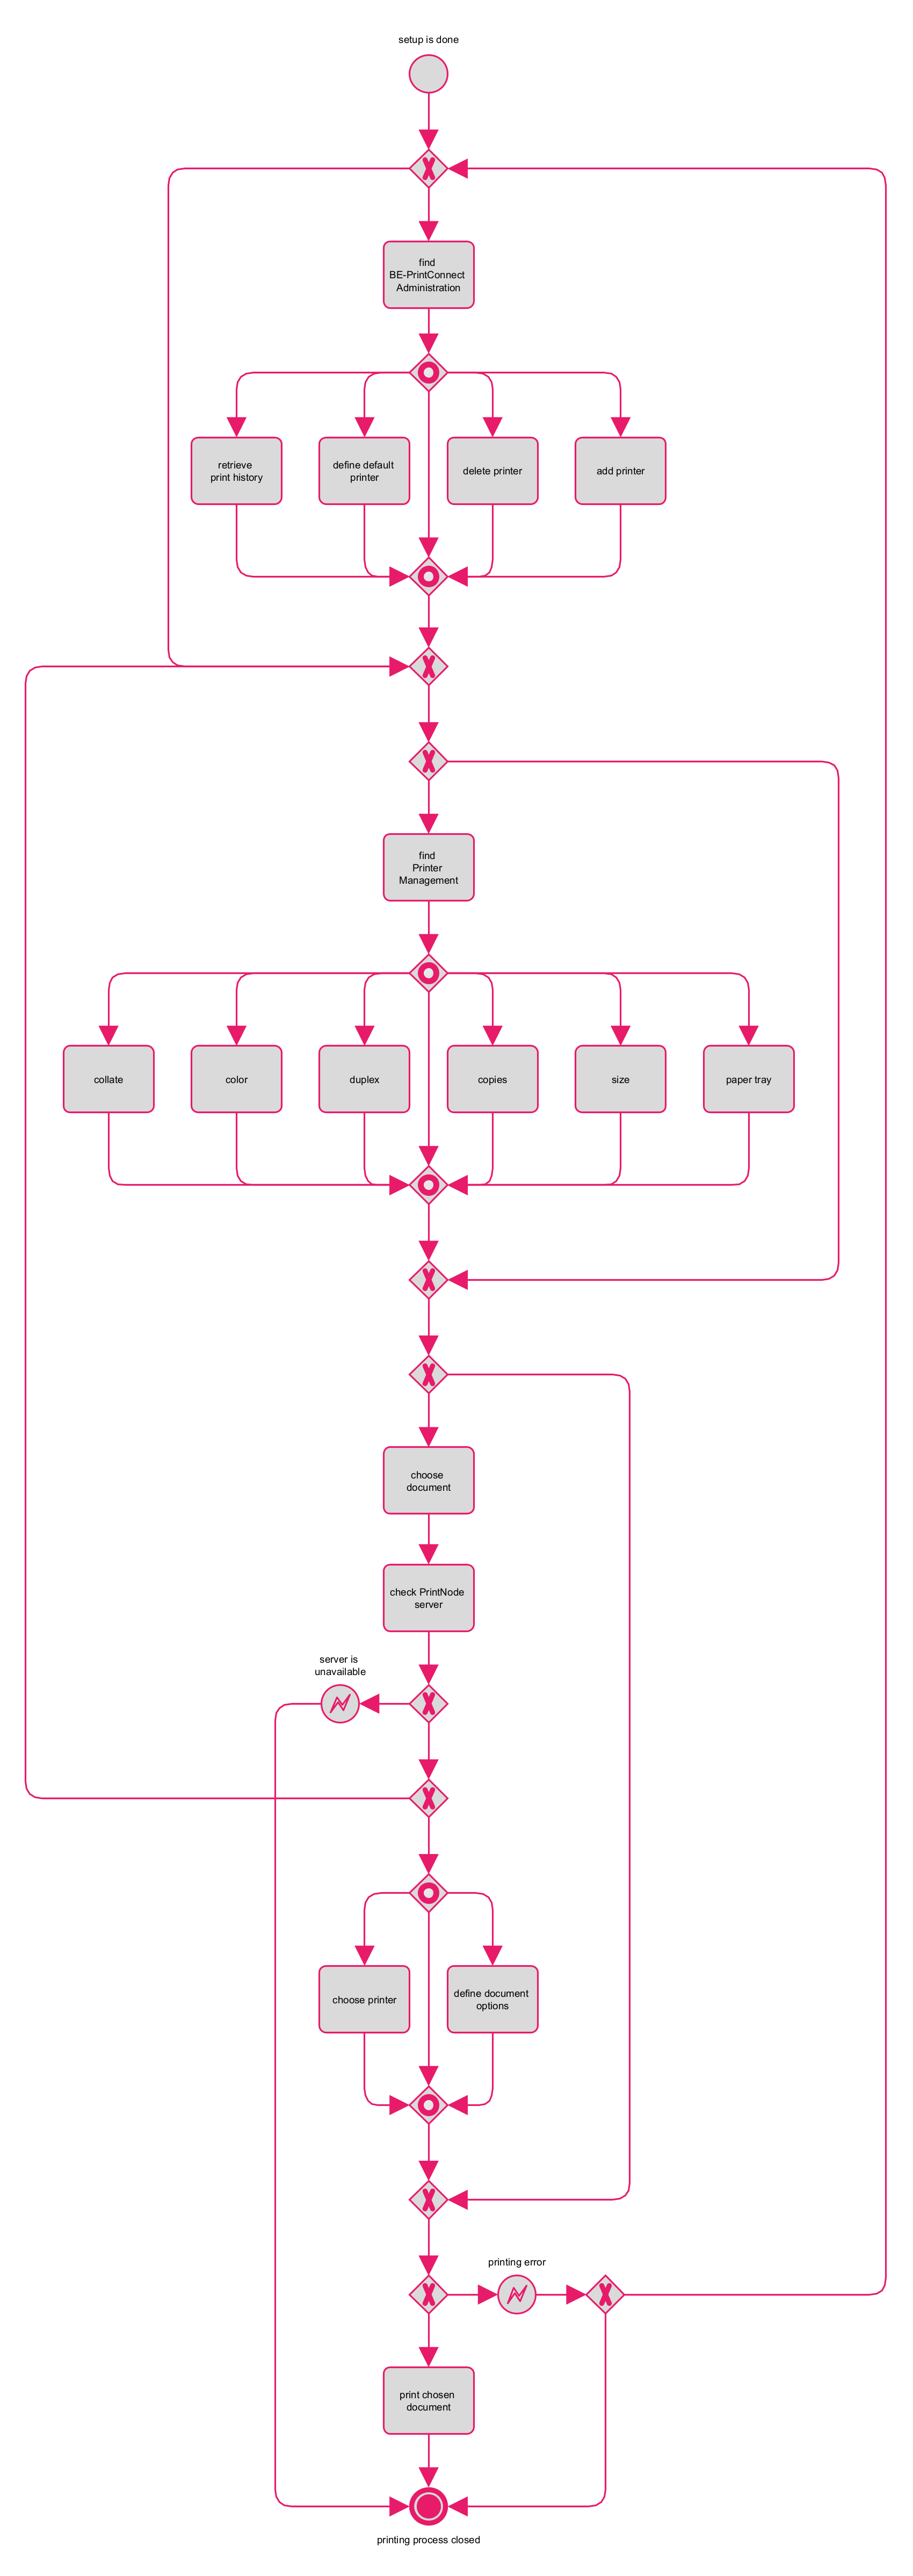
BPMN is used to describe the key processes of using BE-terna Printconnect. The BPMN for BE-terna Printconnect has been divided into two parts, the BPMN of setup and the BPMN of the printing process, to make it more convenient for the readers to understand.
BPMN of Setup
BPMN of Printing Process
Entity Relationship Model
Entity Relationship Model (ERM) for BE-terna Printconnect provides key information on the printing system, in which BE-terna Printconnect works. It visualizes the relationship between different entities in this printing system. The value sets for entities are not included in ERM for BE-terna Printconnect since the goal is to offer core information, which is convenient to understand, for BE-terna clients.
graph LR;
A[End user] --- B{use} --- C[Computer] ---|N| D{visit} ---|1| E[BC server] --- F{install} --- G[BE-terna Printconnect] ---|N| H{communicate} ---|1| I[PrintNode Server] ---|1| J{use} ---|N| K[printer] ---|1| L{print} ---|N| M[document]
C ---|N| O{visit} ------|1| I
C --- P{install} --- Q[PrintNode Client] ---|N| R{communicate} ---|1| I
Q ---|1| S{communicate} ---|N| K
C ---|1| T{use} ------|N| K;
%% Style, Farbe
style A fill:#e71b6a, stroke:#e71b6a, stroke-width:1px
style B fill:#e71b6a, stroke:#e71b6a, stroke-width:1px
style C fill:#e71b6a, stroke:#e71b6a, stroke-width:1px
style D fill:#e71b6a, stroke:#e71b6a, stroke-width:1px
style E fill:#e71b6a, stroke:#e71b6a, stroke-width:1px
style F fill:#e71b6a, stroke:#e71b6a, stroke-width:1px
style G fill:#e71b6a, stroke:#e71b6a, stroke-width:1px
style H fill:#e71b6a, stroke:#e71b6a, stroke-width:1px
style I fill:#e71b6a, stroke:#e71b6a, stroke-width:1px
style J fill:#e71b6a, stroke:#e71b6a, stroke-width:1px
style K fill:#e71b6a, stroke:#e71b6a, stroke-width:1px
style L fill:#e71b6a, stroke:#e71b6a, stroke-width:1px
style M fill:#e71b6a, stroke:#e71b6a, stroke-width:1px
style O fill:#e71b6a, stroke:#e71b6a, stroke-width:1px
style P fill:#e71b6a, stroke:#e71b6a, stroke-width:1px
style Q fill:#e71b6a, stroke:#e71b6a, stroke-width:1px
style R fill:#e71b6a, stroke:#e71b6a, stroke-width:1px
style S fill:#e71b6a, stroke:#e71b6a, stroke-width:1px
style T fill:#e71b6a, stroke:#e71b6a, stroke-width:1px
The Entity Relationship Model visualizes the relationship between different entities in an information system (Chen, 2002):
- The entity types are depicted as rectangular boxes.
- The relationship types are depicted as a diamond-shaped box.
- The value sets (domains) are depicted as circles.
- The cardinality information of the relationship is expressed through “1” or “N” on the lines between the entity types and relationship types indicating the upper limit of the entities of that entity type participating in that relationship.
graph LR;
A[entity 1] ---|1| B{relationship} --- |N| D[entity 2]
A --- C((value set))
A --- G((value set))
D --- E((value set))
D --- F((value set))
style A fill:#e71b6a, stroke:#e71b6a, stroke-width:1px
style B fill:#e71b6a, stroke:#e71b6a, stroke-width:1px
style C fill:#e71b6a, stroke:#e71b6a, stroke-width:1px
style D fill:#e71b6a, stroke:#e71b6a, stroke-width:1px
style E fill:#e71b6a, stroke:#e71b6a, stroke-width:1px
style F fill:#e71b6a, stroke:#e71b6a, stroke-width:1px
style G fill:#e71b6a, stroke:#e71b6a, stroke-width:1px
For more information please read: http://www.ict.nsc.ru/xmlui/bitstream/handle/ICT/1769/Chen_Pioneers.pdf?sequence=1&isAllowed=y